
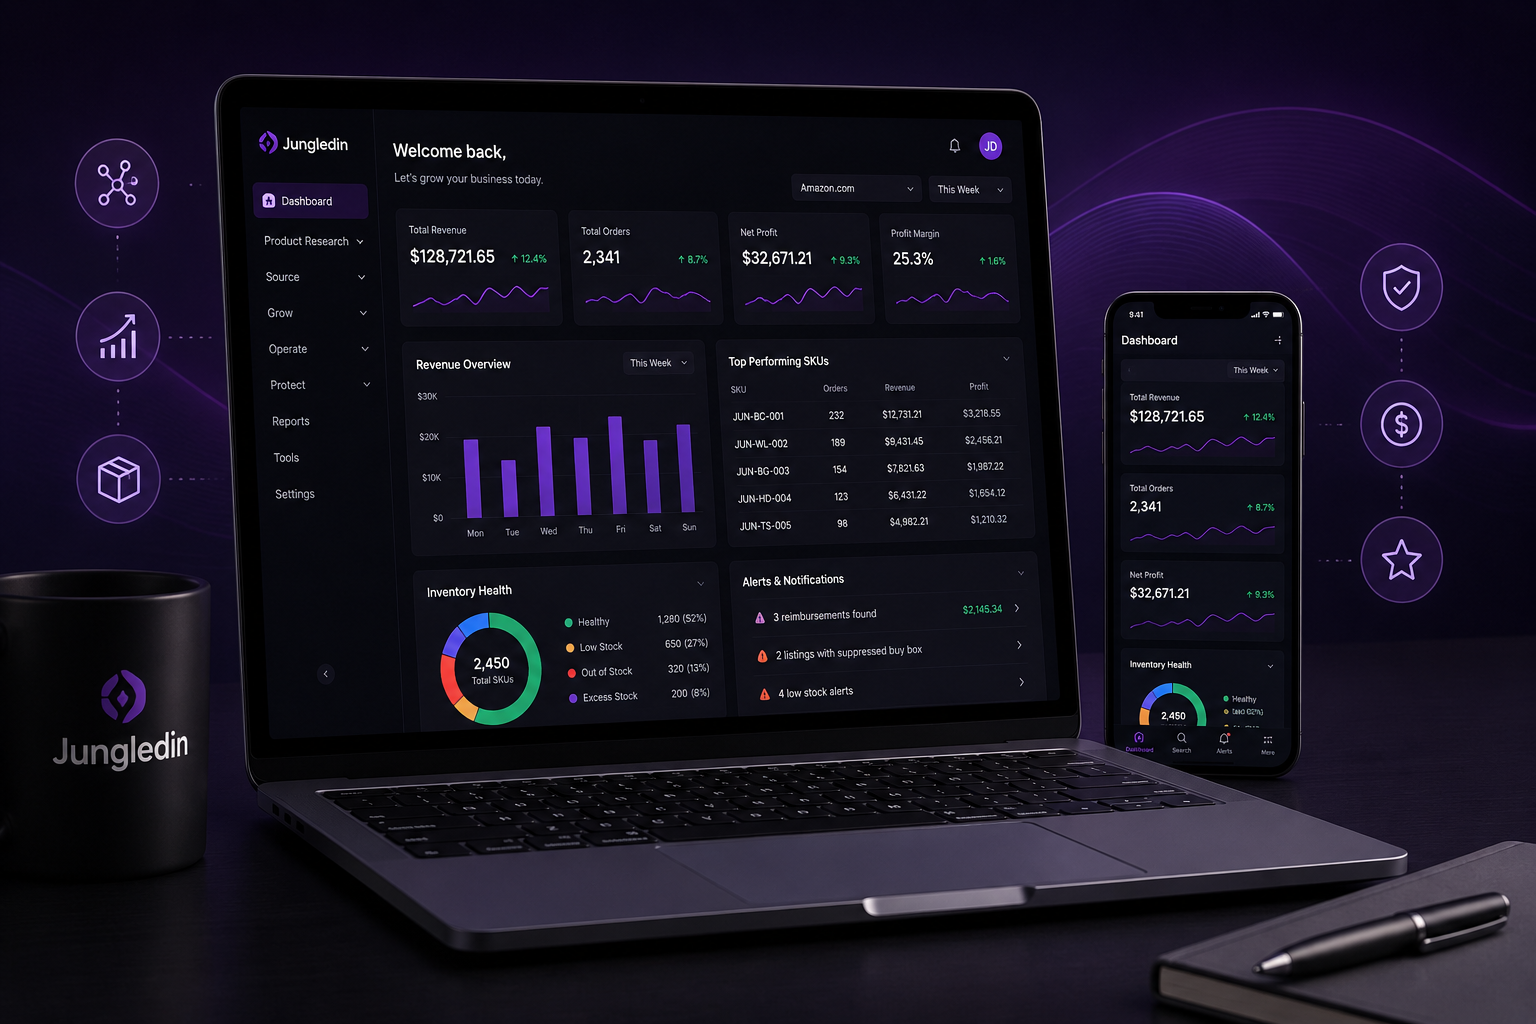

Running an Amazon business means dealing with a lot of numbers.
Sales, orders, fees, inventory, product ratings, margins and marketplace alerts can all change from one week to the next. It is easy to spend time looking at dashboards without knowing which numbers actually deserve your attention.
The solution is not necessarily to track more data.
It is to consistently monitor a small group of Amazon seller metrics that tell you whether the business is moving in the right direction.
A simple weekly review can help you spot declining margins, products that are slowing down, inventory problems and unexpected costs before they become bigger issues.
Here are eight metrics worth checking every week.
1. Revenue
Revenue is the most obvious place to start.
It tells you how much your products generated in sales during a particular period.
For a weekly review, compare your current revenue with:
- The previous week
- Your recent average
- The same period last month
- Any sales targets you have set
The purpose is not simply to celebrate when revenue increases. You want to understand why it changed. For example, imagine your weekly revenue moves from $8,000 to $11,000.
That looks positive, but ask:
- Did one product suddenly perform better?
- Did you increase advertising?
- Did your prices change?
- Did a seasonal event increase demand?
- Did you add new inventory?
- Did the number of orders also increase?
The same logic applies when revenue falls.
A decline does not automatically mean the business is in trouble. It may be caused by stock shortages, pricing changes, seasonality or one high-performing product slowing down.
Amazon’s Seller Central Business Reports can help sellers identify sales trends and compare sales and order performance across periods.
For businesses selling across multiple marketplaces, JungledIn’s Multi-Platform Selling tools can help keep supported marketplace activity within a more connected workflow.
What to ask every week
Is revenue moving up or down, and what caused the change?
That second part is more useful than the number itself.
2. Orders and Units Sold
Revenue tells you how much money came in, while orders and units sold tell you how customers created that revenue.
These numbers should be reviewed together.
Imagine this situation:
Week 1
- 200 orders
- $10,000 revenue
Week 2
- 150 orders
- $10,000 revenue
Revenue stayed the same, but the business changed significantly. Perhaps customers bought more expensive products in Week 2.
Now consider:
Week 3
- 250 orders
- $10,000 revenue
You are processing significantly more orders for the same revenue. That could affect fulfilment costs, customer support requirements and margins.
Tracking orders also helps sellers identify changing product demand. If a particular SKU starts receiving significantly more orders, you may need to review inventory sooner than expected.
Your weekly dashboard should therefore answer:
- How many orders did we receive?
- How many units did we sell?
- Which products generated them?
- Are order volumes increasing or falling?
Revenue without order context tells only part of the story.
3. Gross Profit and Profit Margin
This is one of the most important areas sellers can overlook.
Revenue is not profit.
A product may generate impressive sales while producing a weak financial return. Imagine you sell a product for $40.
After considering:
- Product cost
- Amazon fees
- Fulfilment costs
- Shipping
- Advertising
- Other operating expenses
you may find that only a relatively small amount remains. That is why your weekly review should include both gross profit and profit margin.
Profit helps you understand how much money remains. Margin helps you understand how efficiently sales are producing that profit.
For example, suppose:
Product A
- Selling price: $30
- Estimated profit: $9
Product B
- Selling price: $70
- Estimated profit: $10
Product B produces slightly more profit per sale, but Product A may have a much stronger margin relative to its selling price and investment.
Tracking profit over time also helps reveal problems that revenue alone can hide.
For example:
Revenue increased by 15%, but profit dropped by 5%.
That should immediately lead to questions about:
- Fees
- Product costs
- Pricing
- Advertising spend
- Discounts
- Returns
- Fulfilment costs
JungledIn’s business finance tools are designed to bring areas such as profit and loss, expenses, revenue and costs into a clearer financial view rather than judging performance on sales alone.
You can also connect operational information through Business Operations when reviewing how purchasing and day-to-day costs affect the wider business.
4. Amazon and FBA Fees
Marketplace fees can quietly reduce profitability if sellers only look at top-line sales.
Amazon explains that sellers may pay selling-plan and referral fees, while optional programs such as FBA can create additional costs. FBA-related charges can include fulfilment and inventory storage fees, while aged inventory can create additional surcharges. (Sell on Amazon)
That makes fees worth reviewing regularly.
Depending on your business, monitor areas such as:
- Referral fees
- FBA fulfilment fees
- Inventory storage costs
- Aged inventory costs
- Removal or disposal charges
- Other marketplace deductions
You do not necessarily need to investigate every individual fee every Monday morning.
Instead, watch for unusual movement.
For example:
Fees normally represent around 20% of marketplace revenue, but this week they increased significantly.
That deserves investigation.
Possible causes might include:
- Product mix changing
- Larger or heavier products selling
- Increased storage costs
- Different fulfilment activity
- Inventory ageing
- Other marketplace charges
Amazon also recommends monitoring inventory metrics and storage-related costs as part of managing FBA expenses. (Sell on Amazon)
The key metric is not simply “How much did Amazon charge?”
It is:
What percentage of revenue is being consumed by fees, and is that percentage changing?
5. Inventory Levels and Inventory Health
Few Amazon seller metrics affect both revenue and cash flow as directly as inventory.
Too little stock can lead to missed sales. Too much stock can leave cash sitting in products that are not moving.
Your weekly inventory review should include:
- Units currently available
- Incoming inventory
- Products running low
- Excess stock
- Slow-moving inventory
- Inventory age
- Products requiring reorder attention
Amazon’s FBA Inventory tools are designed to help sellers monitor inventory health, future demand, excess inventory, aged stock and stranded inventory. Amazon’s Inventory Performance Index, or IPI, also measures how efficiently FBA inventory is being managed. (Sell on Amazon)
Amazon describes sell-through as an important inventory indicator and notes that excess inventory can increase storage costs. (Sell on Amazon)
Imagine one of your products normally sells 20 units per week. You currently have 35 units remaining and your supplier takes four weeks to deliver new inventory. The product may not technically be out of stock yet, but it deserves attention immediately.
A useful inventory dashboard therefore needs to answer more than:
How many units do we have?
It should help answer:
Are those units enough for expected demand?
JungledIn’s Inventory Management tools bring warehouse inventory, incoming shipments, FBA inventory and reorder planning into one workflow.
6. Underperforming SKUs and Sales Velocity
Your total business may look healthy while individual products are quietly becoming problems.
That is why SKU-level performance should be part of a weekly review.
Look for products where:
- Sales have slowed
- Revenue is declining
- Inventory is building up
- Competition has increased
- Margins have fallen
- Prices have moved significantly
- Stock is taking longer to sell
Consider this example.
You have 20 active products.
Nineteen continue selling normally, while one product drops from:
- 30 units per week
to:
- 8 units per week
Your total revenue may not change enough to make the problem obvious.
But the product may now be holding significantly more inventory than expected.
Once you identify an underperforming SKU, investigate the cause.
Possible questions include:
- Has the selling price changed?
- Has a competitor reduced its price?
- Has customer demand changed?
- Has the listing lost visibility?
- Have reviews changed?
- Is inventory still available?
- Has the market become more crowded?
Sometimes pricing is part of the issue.
JungledIn’s FBA Repricer allows sellers to define SKU-level minimum and maximum pricing boundaries and apply supported repricing rules within those limits.
The important point is that the dashboard should identify the problem first.
The seller can then decide what action makes sense.
7. Product Ratings and Review Trends
Your average product rating is another metric worth reviewing regularly.
You do not need to panic every time one customer leaves a negative review.
Instead, look for trends.
Suppose a product normally maintains an average rating of 4.5 stars.
Over several weeks, it moves:
- 4.5
- 4.4
- 4.2
- 4.0
That trend deserves investigation.
Look at:
- Average rating
- Number of new reviews
- Rating changes
- Products with sudden drops
- Unusual review patterns
- Repeated customer complaints
Reviews can also provide useful product feedback.
If several customers mention the same packaging problem, missing component or confusing instruction, the issue may be operational rather than marketing-related.
It is important to separate requesting reviews from monitoring review health.
JungledIn’s Seller & Product Feedback module supports Amazon’s official review-request workflow for eligible orders, while Review Health Monitor & Hijacker Alerts focuses on review trends and supported listing concerns.
The objective is not to react emotionally to every review.
It is to identify meaningful changes early.
8. Alerts, Listing Issues and Potential Reimbursements
The final weekly category is not one single sales metric.
It is your “needs attention” list.
A dashboard becomes more useful when it tells you where to look next.
Examples may include:
- Unexpected seller activity
- Buy Box changes
- Inventory discrepancies
- Lost or damaged FBA inventory
- Potential fee discrepancies
- Refund-related issues
- Products requiring review
- Reimbursement opportunities
- Other marketplace alerts
Some problems may have little immediate financial impact.
Others may represent revenue that requires investigation.
For example, imagine Amazon’s records indicate fewer units received than the quantity you expected from an inbound shipment.
That does not automatically mean you are owed money, but it may deserve further review.
JungledIn’s FBA Reimbursements tools are designed to review supported shipment, inventory, payment and fee records for potential reimbursement opportunities.
Listing monitoring also matters.
An unfamiliar seller, changing Buy Box status or unusual rating activity may not always indicate a violation, but it may warrant investigation. The Review Health Monitor & Hijacker Alerts module helps organise these supported alerts.
The weekly question is:
What changed that requires human attention?
That is often one of the most valuable things a dashboard can tell you.
How to Build a Simple Weekly Amazon Seller Dashboard Routine
You do not need to spend hours analysing reports every week.
A consistent 20- to 30-minute review can be more useful than occasionally spending an entire afternoon digging through data.
A simple routine might look like this:
| Metric | What to Check |
|---|---|
| Revenue | Change from previous week |
| Orders | Orders and units sold |
| Profit | Gross profit and margin |
| Fees | Amazon/FBA fees as a share of sales |
| Inventory | Low, excess and incoming stock |
| SKUs | Products gaining or losing momentum |
| Ratings | Rating and review trends |
| Alerts | Issues requiring investigation |
Start with the overall business.
Then move down to the product level.
For example:
Step 1: Check revenue and orders.
If both are normal, move on.
Step 2: Check profit and fees.
If revenue is growing but margin is shrinking, investigate.
Step 3: Check inventory.
Identify products that may run out or products that are building up.
Step 4: Review SKU performance.
Look for unusual changes.
Step 5: Review ratings and alerts.
Identify anything requiring follow-up.
This turns your dashboard into a decision-making tool instead of just a collection of charts.
Do Not Track Metrics in Isolation
One of the most important lessons in eCommerce reporting is that metrics are connected.
A drop in revenue might actually be an inventory problem.
A drop in profit might actually be a fee or pricing problem.
A slow-moving SKU might be connected with poorer reviews.
An increase in sales may create a future stock problem.
For example:
Revenue ↑
Orders ↑
Inventory ↓ rapidly
Reorder risk ↑
That tells a very different story from simply saying:
Revenue increased this week.
This is why connected visibility matters.
JungledIn is designed around bringing product, sales, inventory, financial and operational information into a more connected eCommerce workflow rather than forcing sellers to piece together information from multiple spreadsheets and separate systems. (Jungledin)
How Often Should Amazon Sellers Check Their Metrics?
Not every number requires the same schedule.
Some sellers may monitor orders and inventory daily, while broader financial trends are easier to understand weekly or monthly.
A reasonable approach is:
Daily:
Orders, urgent inventory issues and important alerts.
Weekly:
Revenue, profit, fees, SKU performance, inventory health, ratings and marketplace alerts.
Monthly:
Deeper profit-and-loss analysis, expense trends, catalogue performance and longer-term inventory planning.
The right schedule depends on the size and complexity of your business.
A seller with ten products will have different reporting needs from a team managing thousands of SKUs.
The important thing is consistency.
Final Thoughts
A useful Amazon seller dashboard should not overwhelm you with numbers.
It should help answer a few practical questions:
- Are sales moving in the right direction?
- Are we actually making money?
- Are fees changing?
- Do we have enough inventory?
- Which products need attention?
- Are customer ratings changing?
- Are there marketplace issues we should investigate?
- Is there money or inventory that may require further review?
If you can answer those questions each week, you already have a strong foundation for managing performance.
The eight Amazon seller metrics covered here—revenue, orders, profit, fees, inventory health, SKU performance, review trends and alerts—give you a simple starting point.
As your operation grows, the reporting can become more detailed.
But the goal stays the same:
See what changed, understand why it changed and decide what needs attention next.
JungledIn brings marketplace data, finance, inventory, pricing, operations and account-protection tools into one connected platform for Amazon and eBay sellers. Explore the JungledIn Solutions to see how the individual modules fit into a wider seller workflow.